Breaking into the DllMain
This post is a walkthrough to seting up a breakpoint into DllMain using the Windows Debugger.
The post is divided in the following sections:
The Code
Continuing the research on DLL files, we used as ground the same skeleton code we used to generate a DLL that exports a function by its actual name (without compiler decorations). We added a small enhancement in the code: an empty function that takes the ordinal number 1 so it can be called and facilitate the demonstration purposes.
#include <windows.h>
#include <debugapi.h>

#define DllExport1 comment(linker, "/EXPORT:CallMe=?CallMe@@YGXXZ,@1,NONAME")
#define DllExport comment(linker, "/EXPORT:DoSomeMagic=?DoSomeMagic@@YGXXZ")

void WINAPI CallMe(void)
{
    #pragma DllExport1
}

void WINAPI DoSomeMagic(void)
{
    #pragma DllExport
    OutputDebugStringA("DoSomeMagic was executed");
}

BOOL WINAPI DllMain(HINSTANCE hinstDLL, DWORD fdwReason, LPVOID lpvReserved)
{
    switch(fdwReason)
    {
        case DLL_PROCESS_ATTACH:
            OutputDebugStringA("DllMain was executed");
            DoSomeMagic();
            break;
        case DLL_PROCESS_DETACH:
        case DLL_THREAD_ATTACH:
        case DLL_THREAD_DETACH:
            break;
    }

    return TRUE;
}
Execute the generated DLL
In order to execute the generated DLL, we use the Windows native utility rundll32.exe:
rundll32.exe test.dll, #1
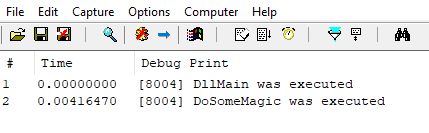
As you can see in the code above, upon execution, debug strings are printed. We can see this strings using SysInternal’s DebugView:
Following the path to DllMain
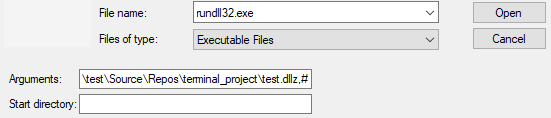
In order to debug the DLL and reach to DllMain, we have to load the DLL in memory. We can do this by opening rundll32.exe on Windbg and setting it to execute our DLL. We follow this path: File -> Open Executable. We the set the appropriate arguments as shown in the following image:
The first break point we hit is on ntdll!LdrInitShimEngineDynamic. Before we continue, we set up a breakpoint to hit when our module gets loaded. This is done with sxe ld test. We carry on with debuggging and we hit the breakpoint as soon as our module is loaded:

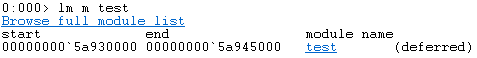
As the DLL is now mapped in memory, we can use lm m test to identify where it was mapped in memory:
Next step is to locate the entry point of our DLL by static analysis so we know where to break. For this, we can use a tool like dumpbin, CFF Explorer, Ghidra or IDA.
To get the entry point using dumpbin:
dumpbin.exe test.dll findstr entry
The entry point as shown on Ghidra:
In order to find the actual bytes of the DllMain we’ll have to add the number dumpbin reports, to the start address that lm m test shows.
?0x00000000`5a930000 + 0x1368
So, the DllMain should start at: 00000000`5a931368
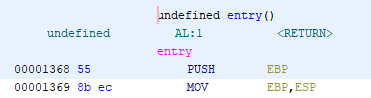
We can confirm that by unassembling the byte that exist on and after this memory address:
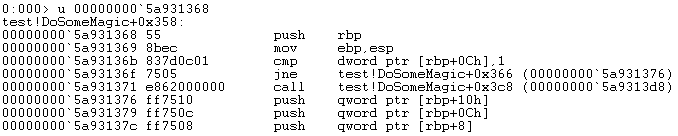
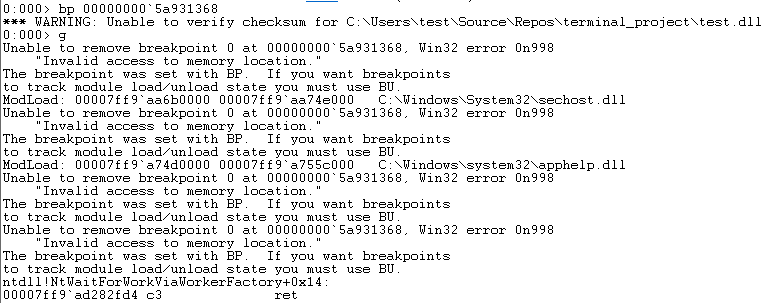
In theory, if we set a breakpoint at 00000000`5a931368 and continue debugging, we should hit the breakpoint and land into DllMain. However that’s what we get instead:
Tools
For this article, we used the following tools:
- Ghidra
- dumpbin
- Windbg